SEO Keyword Performance Analysis with Python, Pandas, and Matplotlib

If you manage content or SEO for a B2B company, you already know how important keyword performance is. It tells you what worked, what didn’t, and where the real opportunities are hiding. Most of us start the year with a long list of keywords—maybe a hundred or more—and spend months creating content around them. Then, at the end of the year, we open up tools like Ahrefs or SEMrush and try to make sense of what actually happened.
Instead of relying only on Excel or pivot tables, this analysis takes things a step further. We use Python to explore 258 keywords and see what the numbers really tell us. And once you start looking at your data this way, you’ll notice something interesting: keywords behave differently when you compare their metrics together rather than one at a time.
For example, does high search volume always mean the keyword is hard to rank for? Does a high CPC mean it’s “better”? Do your top-ranking keywords actually bring the most opportunity? The data has surprisingly clear answers.
As we dug into the numbers—search volume, keyword difficulty, CPC, and current positions—we began to see patterns. Some keywords are clear quick wins: low difficulty but currently underperforming. Others are long-term bets that might take time but could be worth the effort. And of course, some are simply “keep them warm” keywords—not urgent, but worth maintaining.
By the end of this analysis, you’ll have a clear view of where to focus next, which keywords can give you fast results, and which ones are worth investing in over time. Let’s jump in and see what the data reveals.
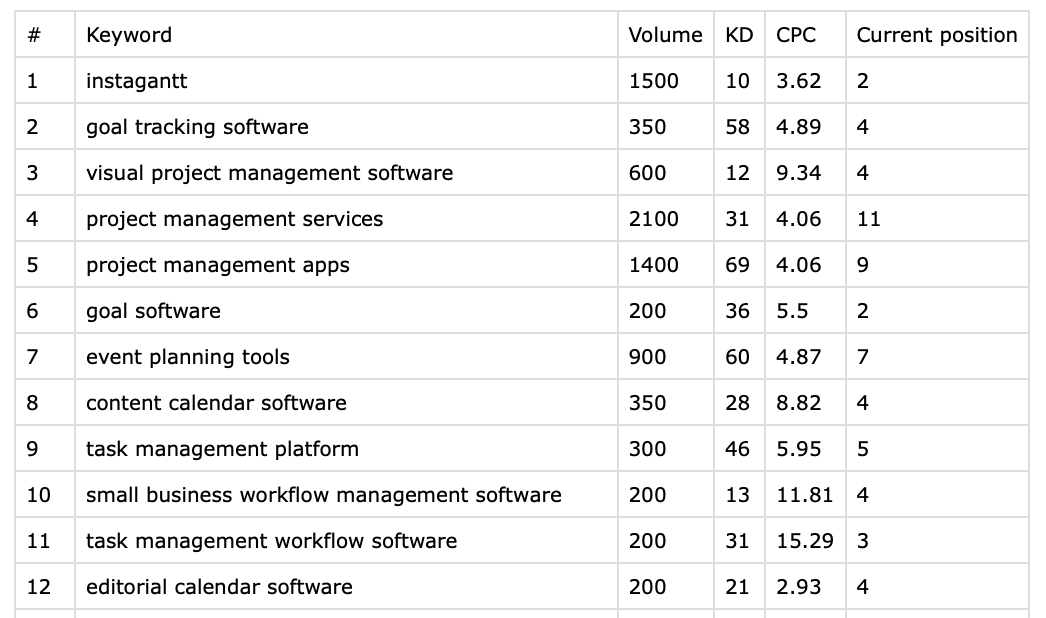
Sample data for analysis:
Keyword Distribution by SERP position ranges
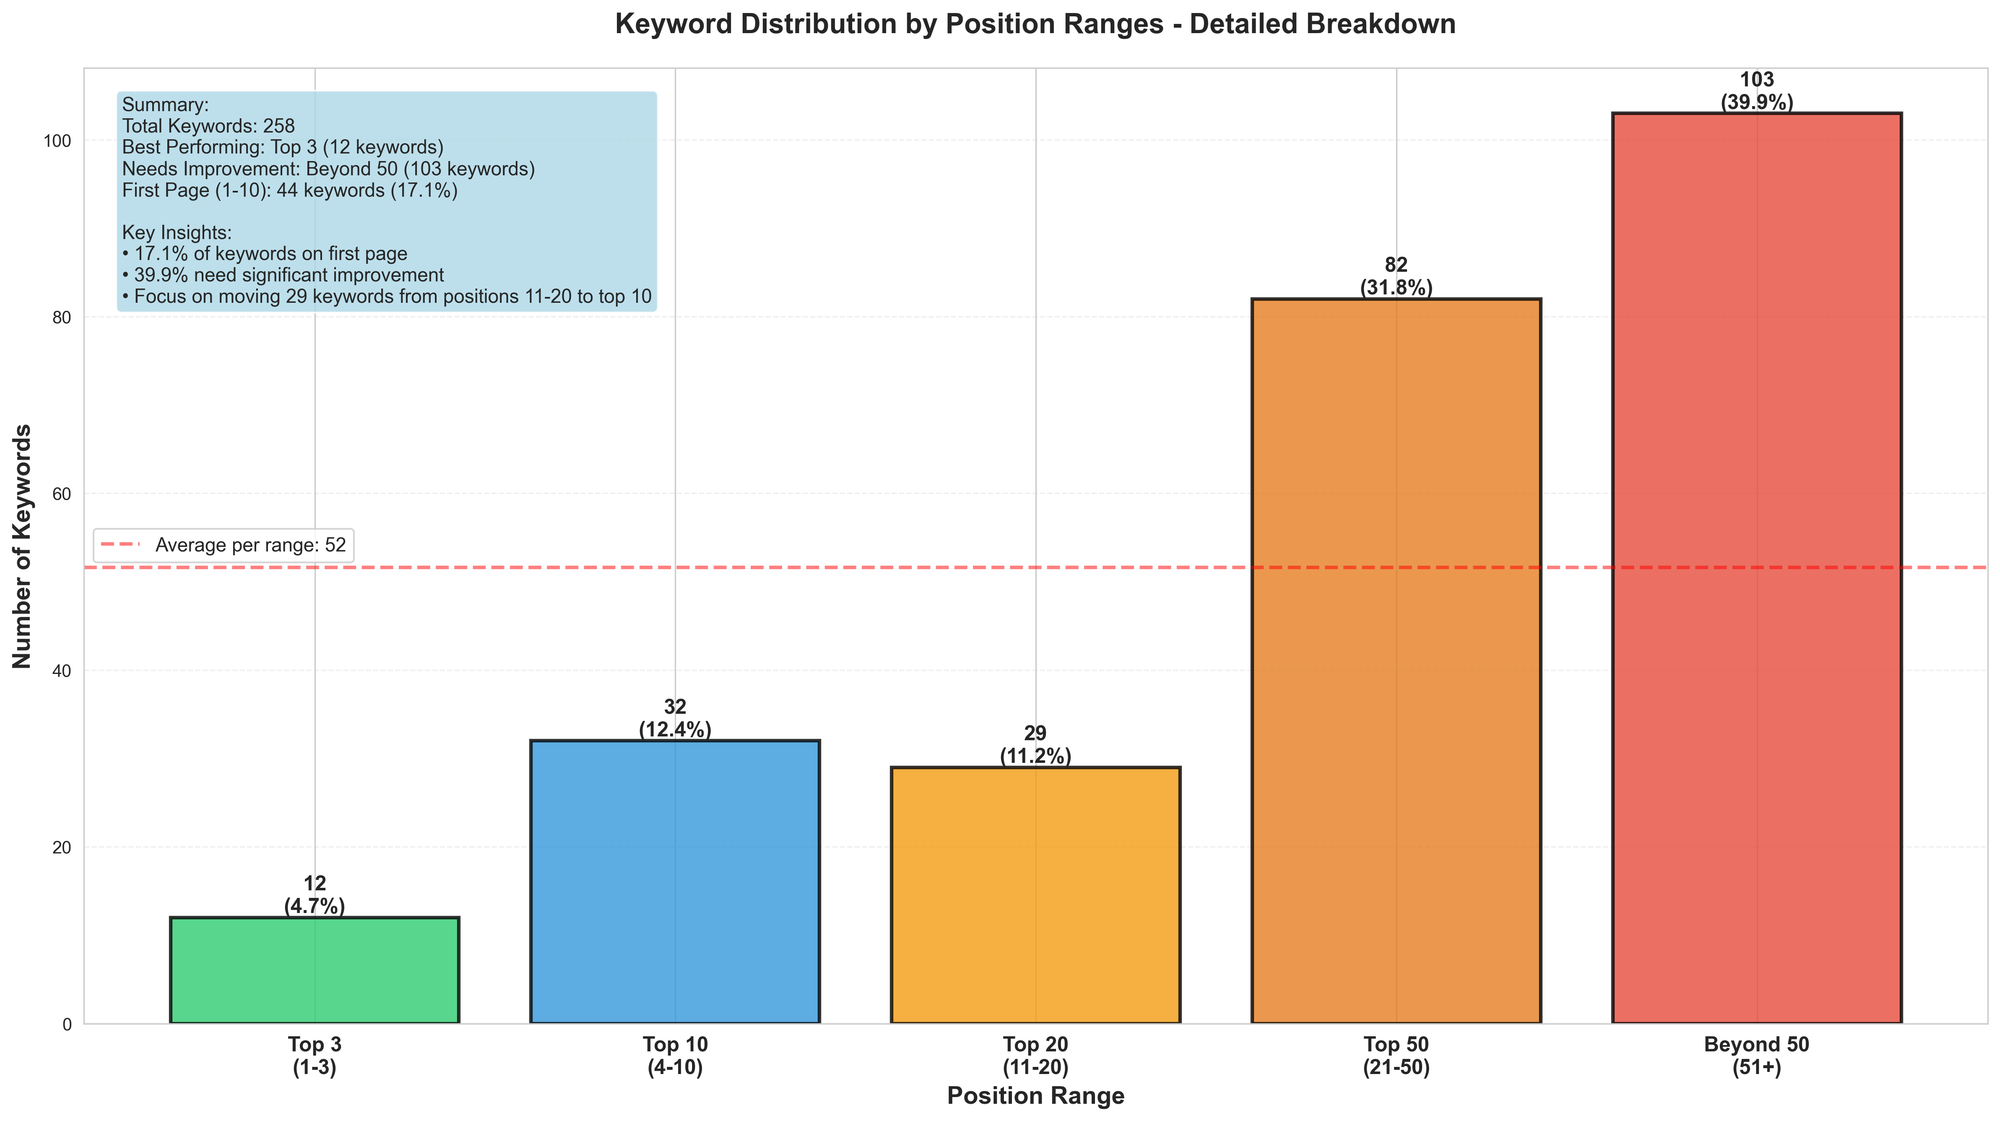
The Keyword Distribution by Position Ranges chart visualizes where your 258 keywords are currently ranking. It divides all keywords into five position tiers and shows how many fall into each tier. Think of it as a health check of your SEO performance.
The Numbers Breakdown

  | Position Range  | Count | Percentage | What It Means            |
  |-----------------|-------|------------|--------------------------|
  | Top 3 (1-3)     | 12    | 4.7%       | Your star performers     |
  | Top 10 (4-10)   | 32    | 12.4%      | First page visibility    |
  | Top 20 (11-20)  | 29    | 11.2%      | Edge of first page       |
  | Top 50 (21-50)  | 82    | 31.8%      | Page 2-5                 |
  | Beyond 50 (51+) | 103   | 39.9%      | Barely visible/invisible |
What This Informs (Strategic Implications)
1. Problem Identification
- Your keyword strategy has a massive efficiency gap.
- You're investing in too many keywords that aren’t ranking well enough to drive real traffic.
2. Opportunity Ranking
- Highest Priority: The 103 keywords beyond position 50 (if they're valuable, this is where ROI is highest).
- Quick Wins: The 29 keywords in positions 11–20 (almost on page 1—minimal effort for big impact).
- Maintain: The 12 Top-3 keywords (protect what's working).
- Monitor: The 82 keywords in the 21–50 range (they might graduate to page 1 with effort).
3. Resource Allocation
- Don’t spread effort equally across all 258 keywords.
- Focus on:
- Keywords just missing page 1.
- High-value keywords beyond position 50.
- Consider deprioritizing low-volume keywords in the 21–50 range.
4. Traffic Impact
- Moving even 10 keywords from positions 11–20 to positions 1–10 would significantly impact organic traffic.
- The gap between positions 10 and 11 is huge in real-world traffic (position 10 gets ~4–5× more traffic than position 11).
Making Sense of the Keyword Opportunity Map: Investment Priority Matrix
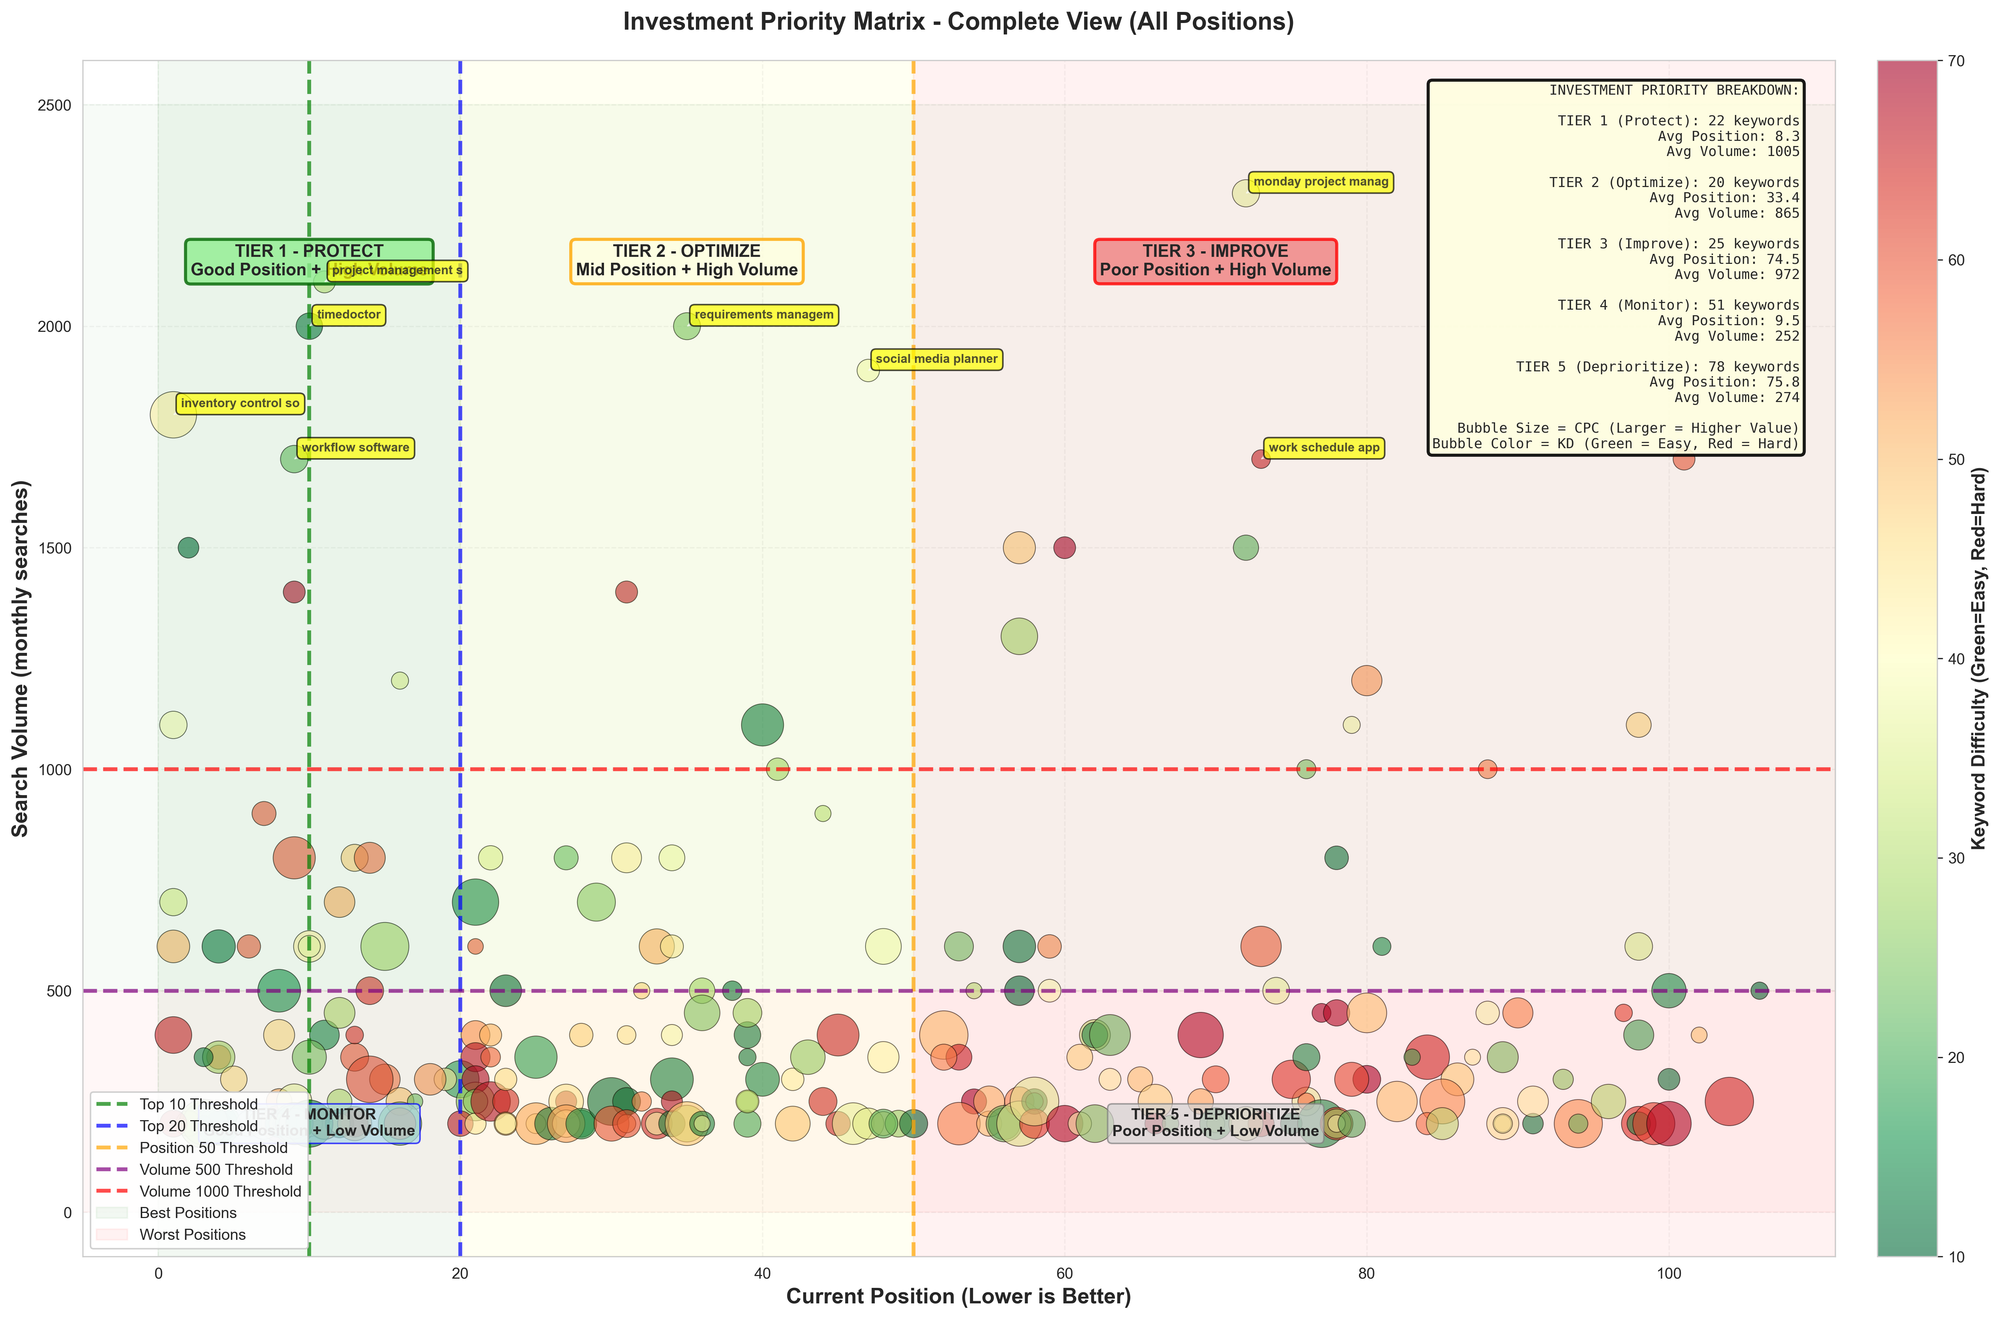
The Investment Priority Matrix helps you decide exactly where to invest your SEO efforts by combining four metrics in a single view:
- X-axis: Current ranking position
- (Left = better, Right = worse)
- Y-axis: Search volume / traffic potential
- (Up = more traffic, Down = less traffic)
- Bubble Size: Cost Per Click / commercial value
- (Bigger bubble = more valuable)
- Bubble Color: Keyword difficulty
- (Green = easy, Red = hard)
The background zones divide your entire keyword set into five strategic tiers.
 ---
  Key Insights from Your Data

  | Metric              | Value      | What It Means                                                          |
  |---------------------|------------|------------------------------------------------------------------------|
  | TIER 1 Keywords     | 22 (8.5%)  | Only small portion of your portfolio is thriving                       |
  | TIER 2 + 3 Keywords | 45 (17.4%) | Your biggest opportunity—45 keywords with high volume but poor ranking |
  | TIER 4 + 5 Keywords | 129 (50%)  | Half your portfolio isn't worth major investment                       |
  | Average KD (Tier 3) | 36.1       | Good news: Most hard-to-rank keywords are actually manageable          |

  ---
Understanding the Five Tiers
TIER 1 – PROTECT (Green Zone, Top-Left)
22 keywords | Avg Position: 8.3 | Avg Volume: 1005
- What: Good position + High volume = Your crown jewels
- Strategy: Maintain and protect these rankings
- Action: Monitor for ranking drops, publish fresh content, update internal links
- Effort Level: Low (maintenance mode)
- ROI: Already getting traffic—focus on holding ground
- Example keywords: "monday project manager," "monday timeline," "instagantt," "workflow software"
TIER 2 – OPTIMIZE (Yellow Zone, Top-Center)
20 keywords | Avg Position: 33.4 | Avg Volume: 865
- What: Mid-range position (21–50) + High volume = Near-miss opportunities
- Strategy: These are quickest wins—only need a small boost to reach page 1
- Action: Content refresh, quality backlinks, on-page SEO improvements
- Effort Level: Medium (3–6 months)
- ROI: Very high—minimal effort for big traffic jumps
- Why it matters: Moving from position 33 to position 10 is huge for traffic
- Example: "requirements manager"
TIER 3 – IMPROVE (Red Zone, Top-Right)
25 keywords | Avg Position: 74.5 | Avg Volume: 972
- What: Poor position (51+) + High volume = Biggest opportunity pool
- Strategy: Long-term growth play with highest ROI potential
- Action: Comprehensive content overhaul, competitive analysis, major link building
- Effort Level: High (6–12 months)
- ROI: Highest potential but requires serious investment
- Why it matters: These keywords prove people search for this topic, but you're invisible
- Example: "work schedule app"
TIER 4 – MONITOR (Blue Zone, Bottom-Left)
51 keywords | Avg Position: 9.5 | Avg Volume: 252
- What: Good position + Low volume = Ranking well for low-traffic terms
- Strategy: Maintain but don’t over-invest
- Action: Monitor performance, look for expansion opportunities
- Effort Level: Minimal
- ROI: Low (traffic isn’t there, but worth keeping)
- Why it matters: Not hurting you, but not helping much either
TIER 5 – DEPRIORITIZE (Gray Zone, Bottom-Right)
78 keywords | Avg Position: 75.8 | Avg Volume: 274
- What: Poor position + Low volume = Waste of effort
- Strategy: Consider removing from focus or consolidating
- Action: Redirect effort to higher-value keywords
- Effort Level: Should be zero—ignore these
- ROI: Negative—resources are better spent elsewhere
Reading the Individual Bubbles
Example: "Monday project manager"
(Top-left, large green bubble)
- Position: ~2
- Volume: ~2100 searches/month
- Bubble size: Large (high CPC)
- Color: Green (low KD)
- Status: Cash cow — protect at all costs.
Example: "social media planner"
(Middle-top, medium bubble)
- Position: ~50
- Volume: ~1500
- Bubble size: Medium (medium CPC)
- Color: Yellow/orange (medium-high KD)
- Status: Harder to improve but worth trying.
Identifying low-hanging fruit for quick wins
The Low-Hanging Fruit analysis highlights your best quick-win opportunities—keywords that meet three criteria:
- Low Keyword Difficulty (KD ≤ 40): Easy to rank for
- Decent Search Volume (≥ 200/month): Worth the effort
- Poor Current Position (> 10): Plenty of room to improve
Essentially: Profitable keywords that are easy to rank for, but you're currently invisible for them.
Key Statistics from Your Data

  | Metric                  | Value             | What It Means                            |
  |-------------------------|-------------------|------------------------------------------|
  | Total Low-Hanging Fruit | 165 keywords      | Massive opportunity pool                 |
  | Shown in Detail         | Top 20 by KD      | Most actionable targets                  |
  | Average KD              | 11.1 (Very Easy!) | These are genuinely easy to rank for     |
  | Average Position        | 48                | Currently invisible but close to fixable |
  | Total Volume            | 7,800/month       | Combined traffic potential across top 20 |
How to Read This Plot
Left Side (Bar Chart)
- Green bars = Keyword difficulty (shorter = easier to rank for)
- Position numbers on the right = Current ranking
- Sorted by KD = Easiest keywords appear at the top
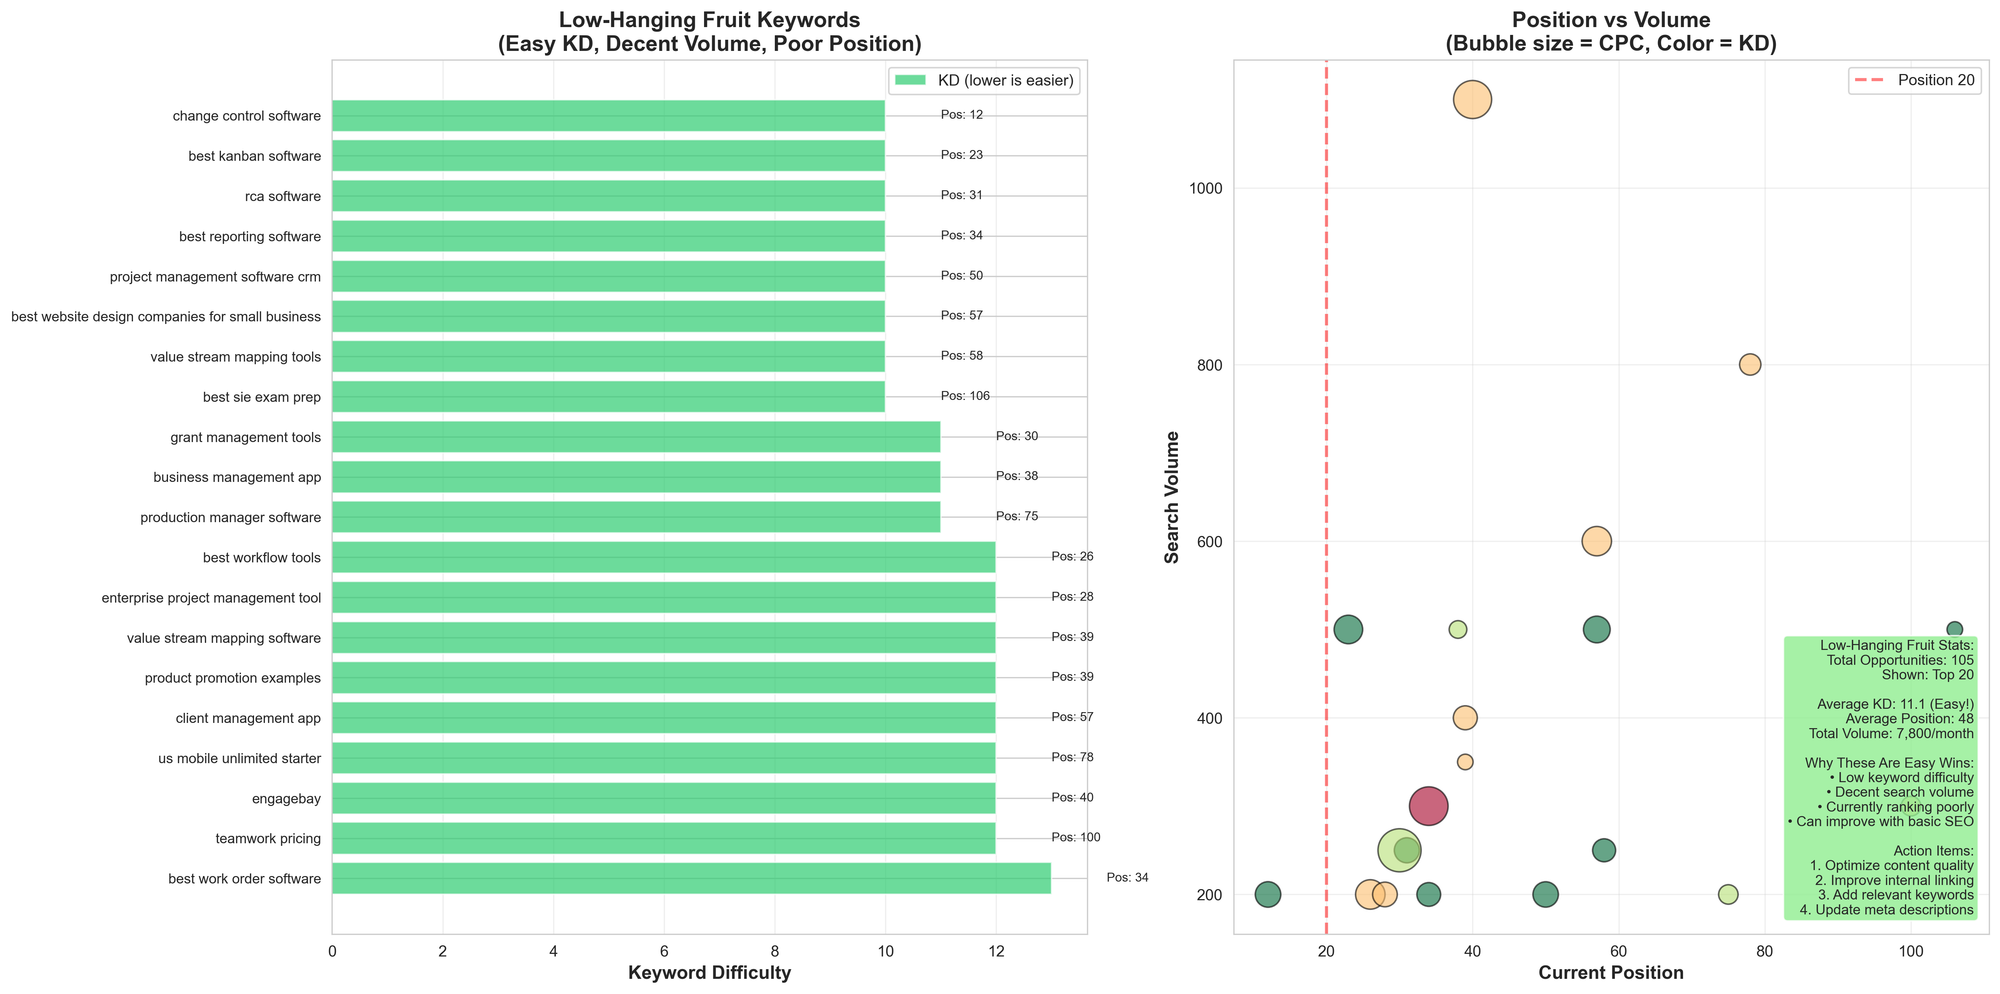
Right Side (Scatter Plot)
- X-axis: Current position (left = better)
- Y-axis: Search volume (up = more traffic)
- Bubble size: CPC value (bigger = more commercially valuable)
- Bubble color: KD (green = easy, orange/red = harder)
- Red dashed line: Position 20 threshold (page 1 boundary)low-hanging
SEO Keyword Analysis Executive Reporting Dashboard.
The SEO Dashboard is a complete health check of your keyword portfolio. It brings together nine visualizations into one unified view, helping you quickly understand:
- Where you stand currently
- What’s working
- What needs improvement
- Where the opportunities are
Think of it as your SEO “cockpit”—everything you need for strategic decision-making at a glance.
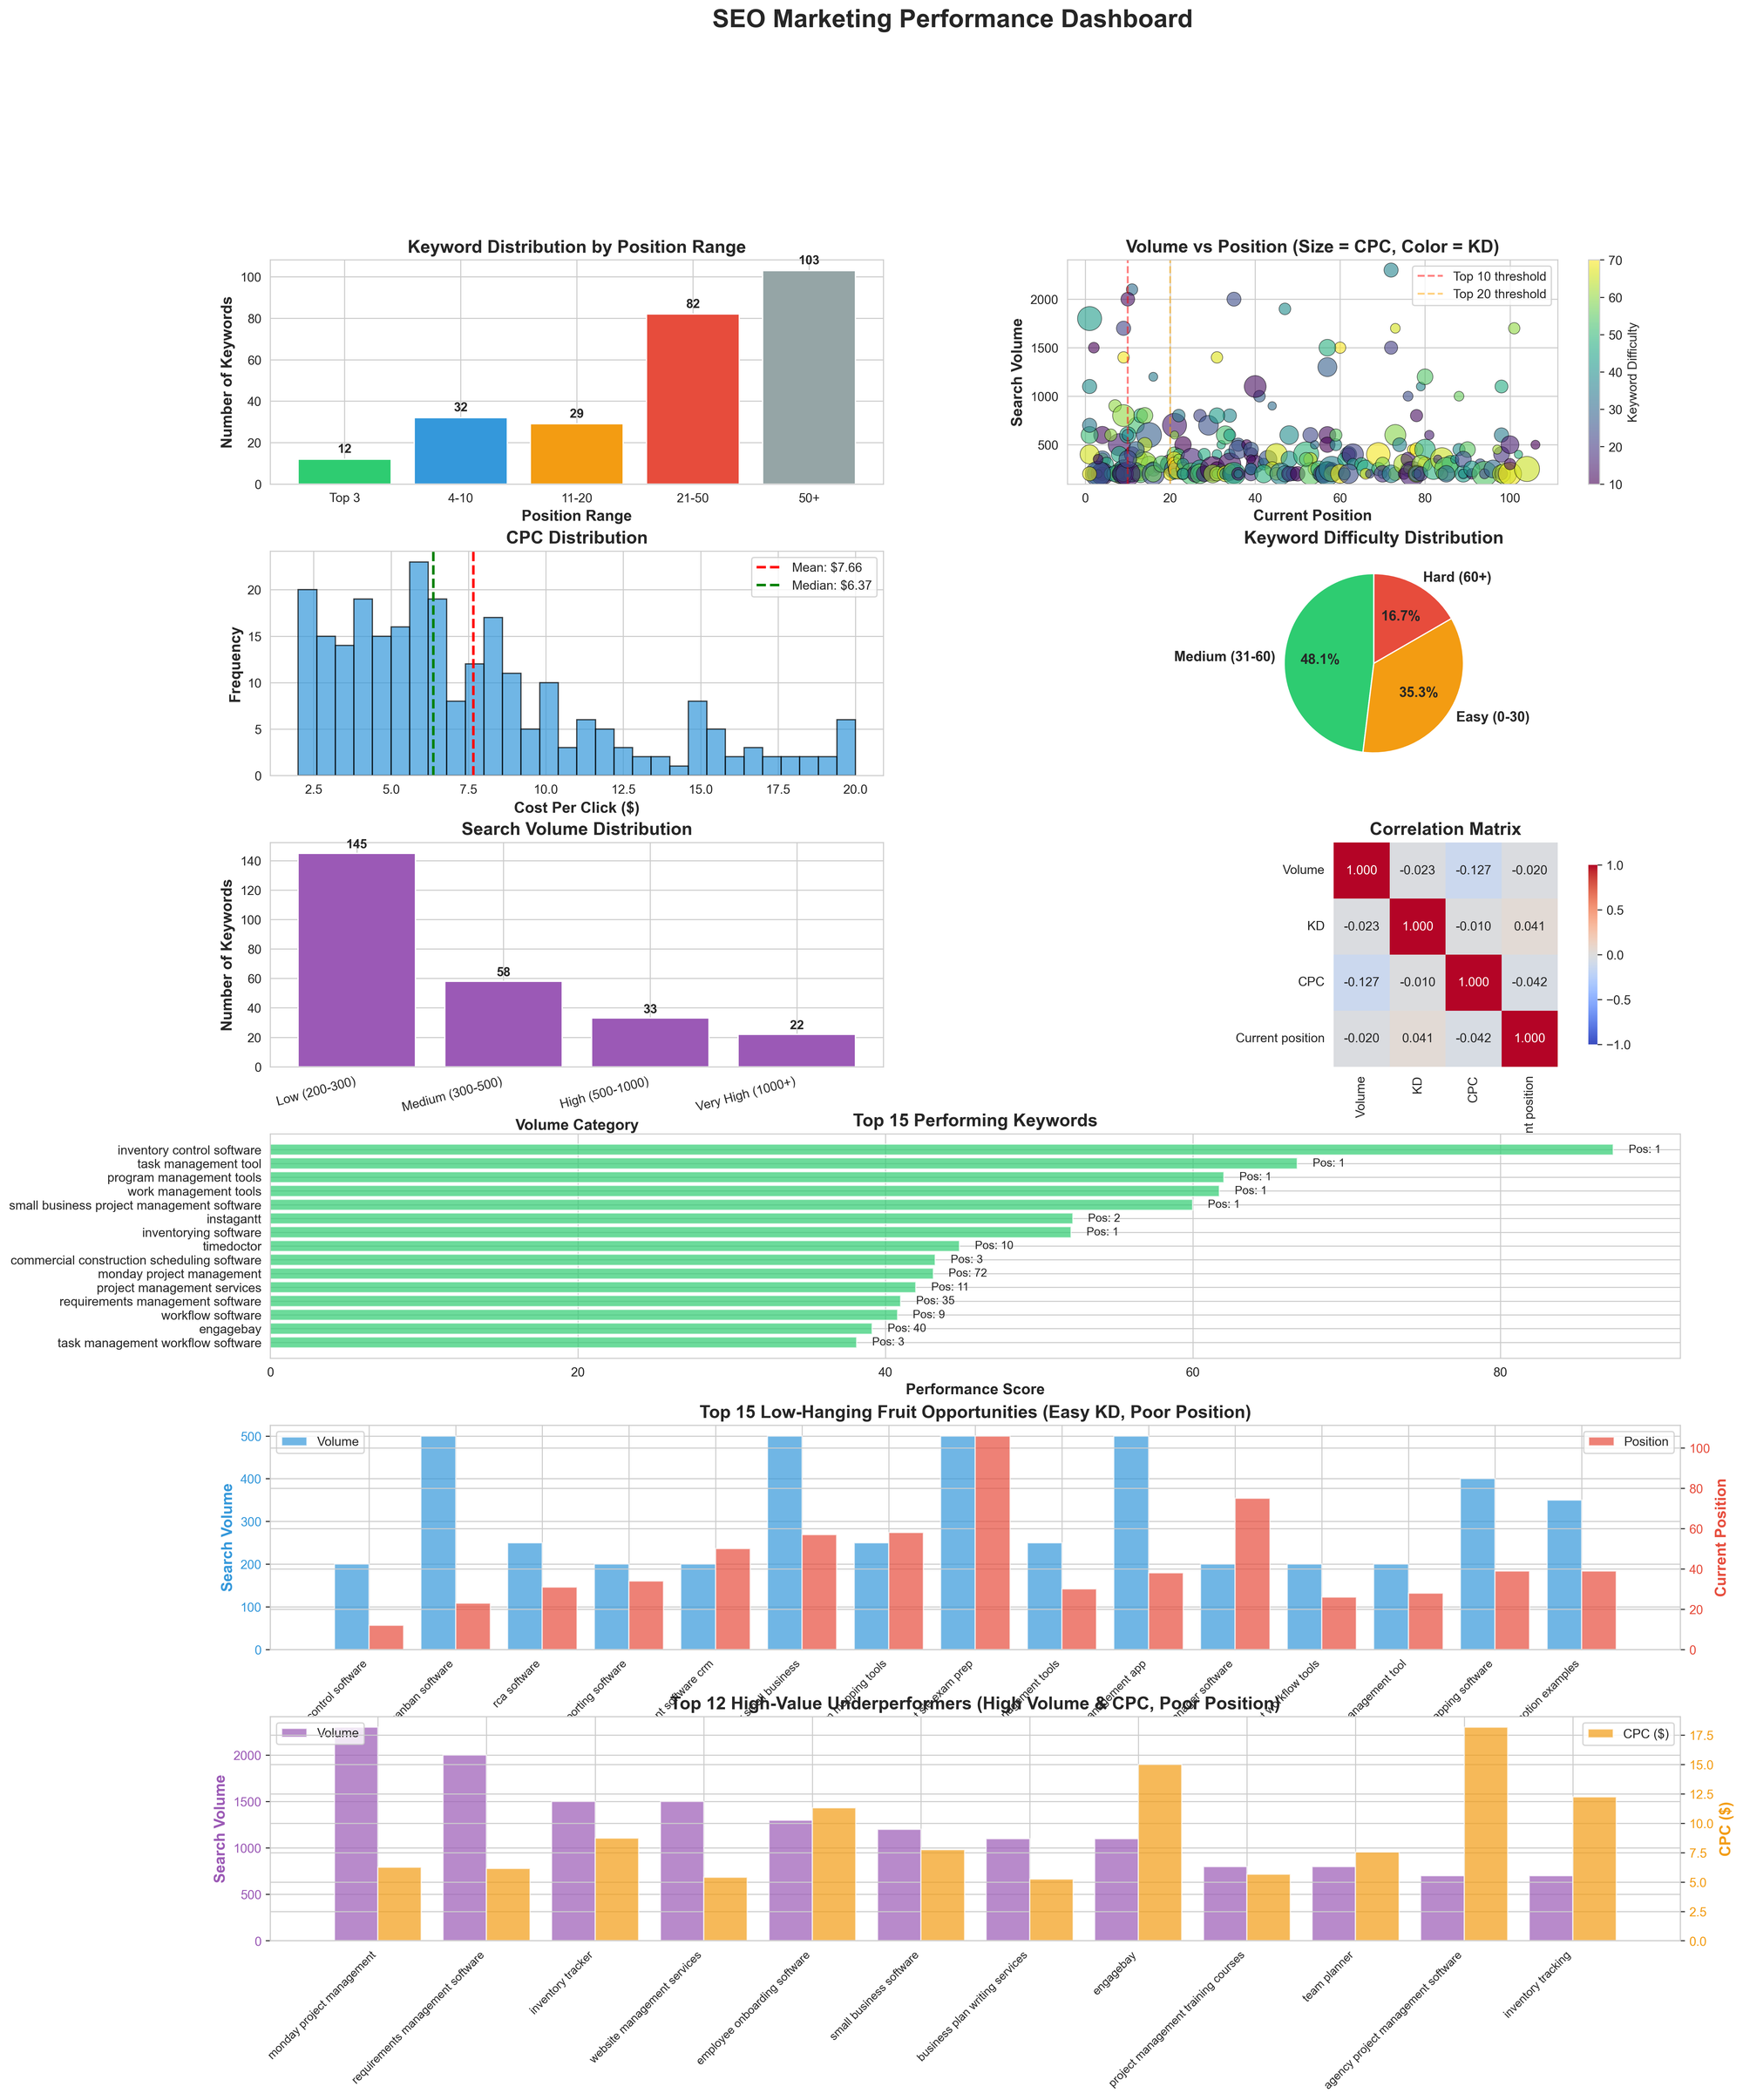
The 30-Second Dashboard Takeaway
You have 258 keywords but only 44 on the first page. Most keywords are easy to rank for (48%), which means your underperformance is an execution issue, not a competition issue. Your biggest opportunities are:
(1) Quick wins — 15 keywords with low difficulty but poor rankings that could move to page 1 with minimal effort,
(2) Value plays — 12 keywords with high volume and high CPC value currently invisible but worth major investment, and
(3) Protecting — 15 keywords that are already performing and driving revenue
Key Metrics to Watch Going Forward

  | Metric                       | Current    | Target    | Timeline  |
  |------------------------------|------------|-----------|-----------|
  | First Page Keywords (Top 10) | 44 (17.1%) | 80 (31%)  | 6 months  |
  | Top 3 Keywords               | 12 (4.7%)  | 25 (9.7%) | 12 months |
  | Average Position             | ~50        | ~25       | 6 months  |
  | High-CPC Keywords in Top 20  | ~5         | ~15       | 3 months  |
Conclusion
Here's what blew our minds while doing this analysis: All these insights came from a simple CSV file with 258 rows. With Python, pandas, and a little visualization magic (matplotlib and seaborn), we turned raw data into actionable intelligence in under a minute. No expensive SEO tools. No guesswork. Just data telling your story.
This is the power of understanding your numbers—you can spot patterns, identify opportunities, and make decisions backed by evidence instead of hunches. If you're managing a keyword portfolio without this kind of analysis, you're leaving money on the table. Start collecting your data today, and in a few weeks, you'll have the clarity you need to double your first-page rankings.